Restaurant Management Software: A Buyer's Guide for 2026
Choosing restaurant management software in 2026? Compare modules, pricing models, and integration tradeoffs in this practical guide for owner-chefs and GMs.
Only 28% of restaurant operators say their technology investments have improved profitability, even though 69% report better operational efficiency and productivity, according to the National Restaurant Association's 2025 industry summary. That gap should shape every software purchase.
Restaurant management software isn't valuable because it has a long feature list. It earns its keep when it helps a restaurant seat more of the demand it already has, reduce avoidable labor pressure, protect kitchen pacing, and turn service data into decisions. The right system should be judged against covers per available seat hour, table release time, walk-in conversion, labor minutes per cover, and no-show-adjusted revenue.
For independent restaurants in the Benelux, the practical choice is usually between a connected platform and a collection of point tools. The cheaper-looking option often becomes expensive when staff re-enter data, managers reconcile conflicting reports, and reservations sit apart from the floor plan.
Table of Contents
- What Restaurant Management Software Actually Does in 2026
- Core Modules and What They Actually Do on a Service
- How Reservation, Table, and Pacing Data Become One Decision
- Commission Aggregators Versus Subscription Platforms
- A Practical Evaluation Checklist for Owner-Chefs
- Implementation Roadmap and Belgian GKS Compliance
- Measuring Whether the Software Actually Paid for Itself
What Restaurant Management Software Actually Does in 2026
Industry estimates put the global restaurant management software market at approximately USD 10.2 billion in 2023, with a projection of USD 23.3 billion by 2030 and compound annual growth of about 12.2%, according to World Metrics' restaurant management software market overview. The category covers different combinations of point of sale, inventory, labor, ordering, reservations, and analytics, so compare capabilities rather than market labels.
The practical shift is from locally installed systems to cloud platforms. Cloud access lets you change menus, pricing, permissions, reports, and operating rules across devices or locations without maintaining local servers. That helps an independent restaurant reduce technical overhead. A group can set shared controls while leaving each venue in charge of its floor plan, availability, and service rules.
Efficiency isn't the same as profit
The National Restaurant Association's 2025 industry summary makes the buying test clear: improved productivity does not automatically produce improved profitability. A faster host, cleaner report, or better-organized service matters only if it increases usable cover capacity, lowers the labor ratio, protects revenue, or removes work that staff would otherwise repeat.
Set those measures before you review a demo. Track covers per available seat hour, table release time, walk-in conversion, labor minutes per cover, and no-show-adjusted revenue. For Belgian operators, add GKS compliance to the acceptance criteria. A platform that cannot support the required operating and reporting controls should not reach the shortlist, regardless of its interface or feature count.
The productivity-versus-profitability gap is where software purchases succeed or fail. Monthly fees, training time, integration costs, and extra data entry can consume the gains. Require the vendor to show which shift-level decision changes, what baseline supports the claim, and how you will connect the result to labor, sales, kitchen capacity, and compliance.
Practical rule: A dashboard that does not change a decision during service is reporting, not management.
Review restaurant management essentials for broader operating guidance, but judge software against your own service. The right system coordinates reservations, table availability, orders, guest details, labor information, and performance reporting in one working environment. Treat it as operating infrastructure only when it helps you seat more viable demand, control labor, and verify compliant performance.
Core Modules and What They Actually Do on a Service
Judge a software demo against a busy shift. Ask what the host, server, chef, or manager can decide at a specific moment, and whether that decision changes measurable service output.
Reservations create the demand picture
The reservation module records party size, arrival time, confirmations, notes, and expected demand. During service, the host needs more than names on a list. They need to see late bookings, occupied tables, parties that can be seated early, and openings for walk-ins without damaging later reservations.
Table management converts that information into a live floor plan. It displays table status, combines or separates tables, assigns zones, and prevents the host from promising capacity the room cannot deliver. Test one concrete case: a late party arrives at 8:47pm, and the host must move it without losing the next seating. Measure the resulting table release time, not just the number of available buttons on screen.
Pacing protects the kitchen
Pacing connects bookings and walk-ins to production capacity. If several parties arrive together, the kitchen absorbs the pressure through congested tickets, delayed courses, and extra labor. The manager should be able to control availability, stagger arrivals, and place a walk-in only when the kitchen and floor can handle it. The service result is measurable in covers per available seat hour and labor minutes per cover.
Point of sale closes the operational loop. It records purchases, check-open times, payments, and menu movement. Inventory can use those sales to track depletion and food cost, while scheduling compares labor deployment with demand. The modules can come from different vendors, but their handoffs must preserve timing and service context.
Each module needs a service test tied to an outcome. Reservations should help convert a suitable walk-in without displacing a booked party. Table management should show when a table is ready for another cover. Pacing should prevent a seating decision that overloads the pass. Point of sale should let you compare sales, covers, table times, and labor minutes per cover at close.
Ask the vendor to demonstrate the full workflow, including the 10seat features, against your actual floor plan. For Belgian operators, require the reporting and control needed for GKS compliance before you compare interface details. A platform that cannot support those controls is not a workable operating system for the restaurant.
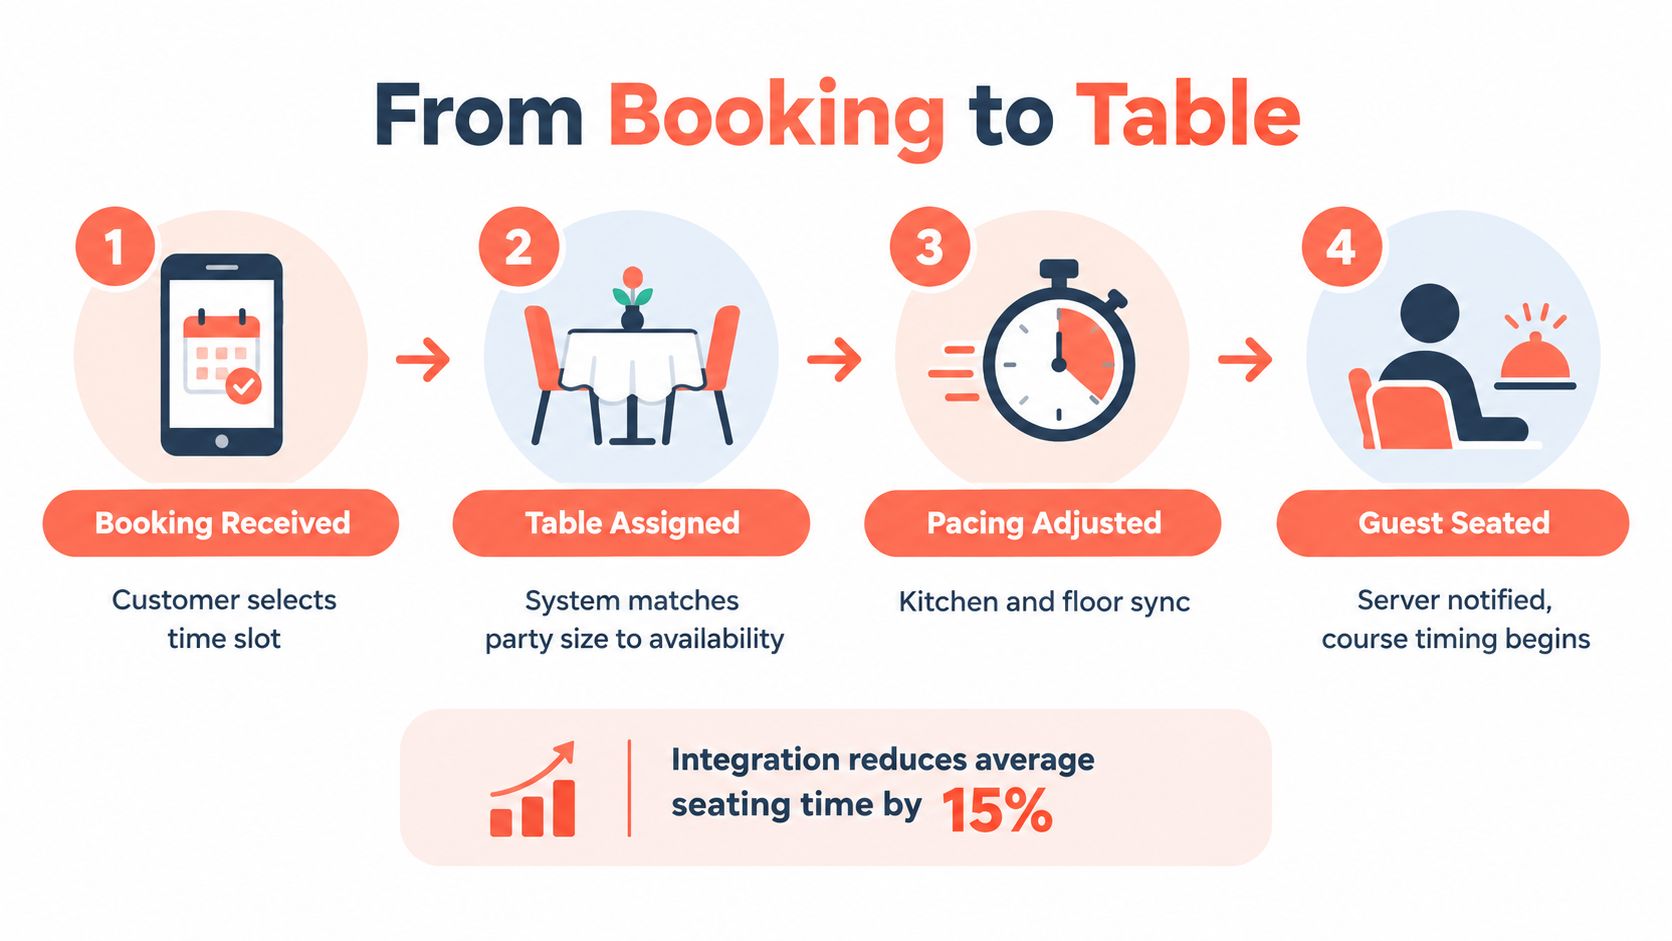
A short visual explanation can help staff understand the booking-to-seating workflow before a trial begins.
How Reservation, Table, and Pacing Data Become One Decision
Integration isn't a checkbox. It's the chain that lets one booking influence several live decisions without someone copying information between systems.
A booking begins with demand: party size, arrival time, duration expectation, and any relevant guest note. The table engine then checks available configurations, not just empty tables. The pacing layer asks whether seating that party now fits the kitchen and floor workload. Once seated, the system records the table status and eventually the release time, giving the manager a basis for the next service decision.
When those steps share data, the host can see the operational consequence of a choice. Seating a party at a four-top may solve the immediate wait while removing the only sensible option for a larger booking later. Holding that table may protect future capacity but create unnecessary idle time now. The right decision depends on demand mix, arrival intensity, table location, and expected dining duration.
The handoff is where value disappears
A fragmented stack loses context at every boundary. The reservation tool knows the booking, the point of sale knows the check, and a spreadsheet may contain labor. None of them necessarily agrees on when the table was seated, whether the party arrived as booked, or why the floor manager held a section.
A 2025 restaurant technology survey found that 32% of operators identified vendor data silos as an obstacle, 21% cited staff silos, and 30% cited a lack of cost transparency or high monthly fees.Restaurant Technology Outlook More than one-third said their biggest data challenge was making datasets actionable. That is the distinction between having data and being able to use it during service.
The core measures should follow the decision chain:
- Covers per available seat hour: How effectively does the room convert capacity into covers?
- Seating-to-release time: How long does a table remain occupied from seating through release?
- Waitlist abandonment: How many guests leave before the restaurant can seat them?
- Server-section balance: Does the floor distribute work fairly?
- Labor minutes per cover: Does added capacity require added labor?
The system doesn't need to automate every judgment. It needs to put the relevant facts in front of the person making the judgment. For an owner-chef, that means fewer arguments between reports and a clearer link between floor-plan decisions and the end-of-service result.
Commission Aggregators Versus Subscription Platforms
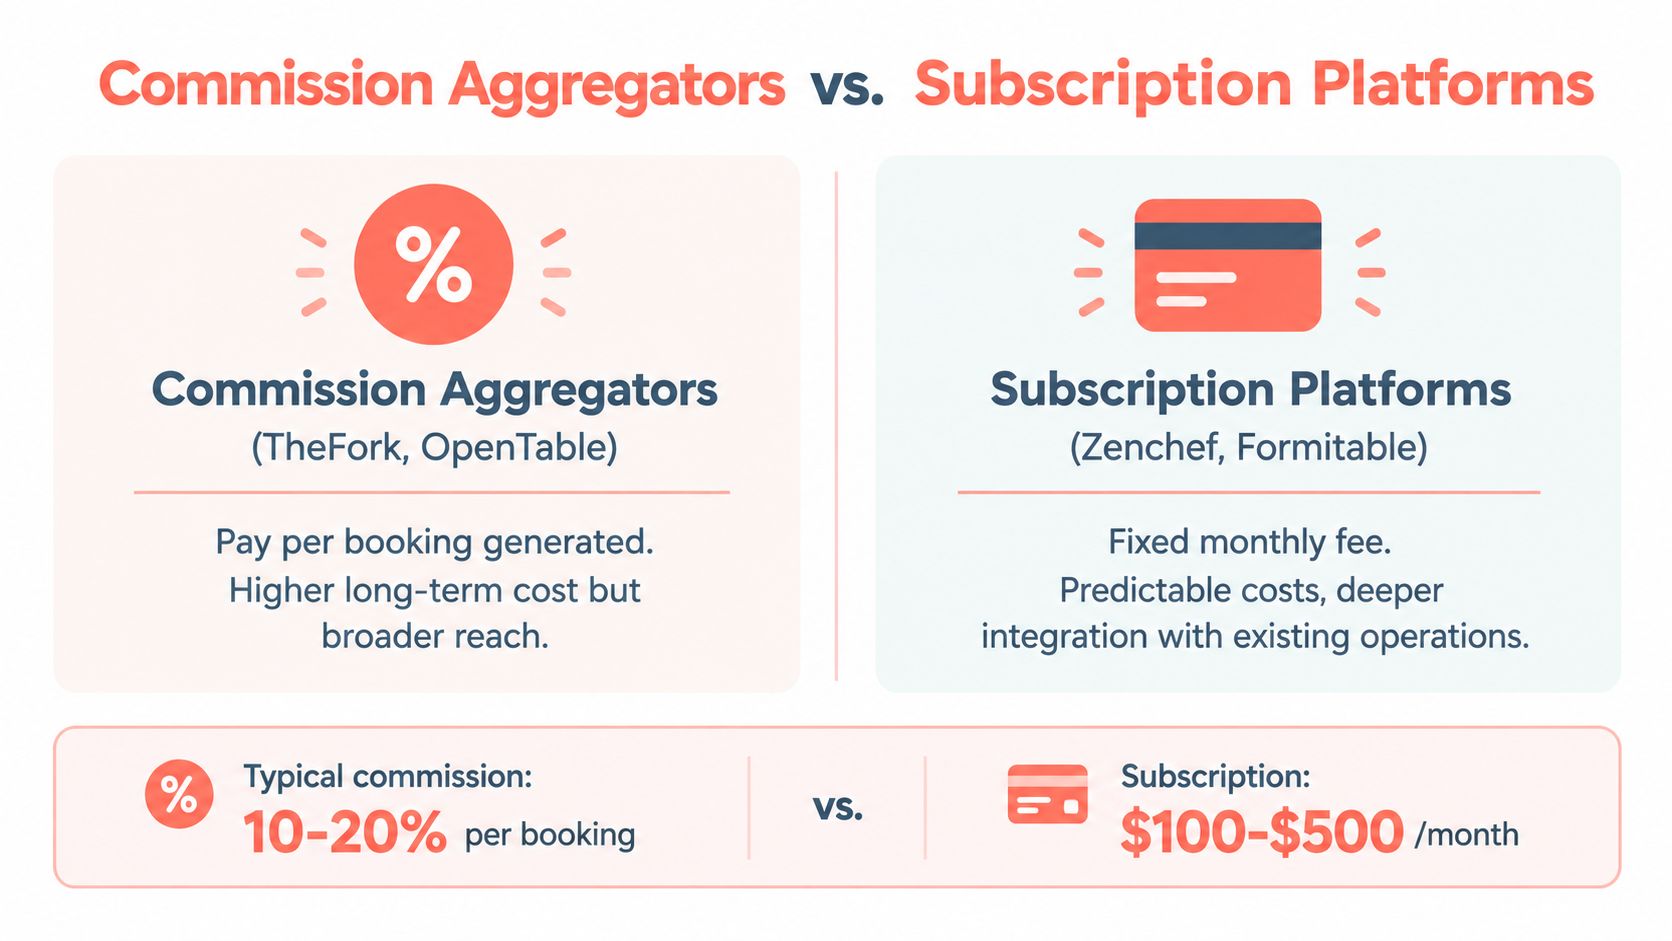
The pricing model changes the economics before the first reservation arrives. Commission aggregators such as TheFork and OpenTable can provide demand generation and broad reach, while subscription platforms such as Zenchef, Formitable, and 10seat focus on predictable software cost and operational control. Neither model is automatically right. The fit depends on how much of the restaurant's demand must come from the platform.
A commission model charges when a booking is generated. That can make the initial commitment feel light, particularly for a new venue that wants exposure. The tradeoff is that the cost grows with covered revenue or booking volume. The restaurant pays again for demand it may already have created through its own website, social channels, regular guests, or local reputation, depending on the contract.
A fixed subscription separates the software bill from each individual cover. The restaurant pays a predictable fee and keeps more control over direct demand, but it carries that fee during quieter periods. A subscription also doesn't create a marketing audience automatically. The operator still needs a strong booking page, clear availability, and a plan for converting direct traffic.
Read the contract against the dining room
The often-quoted comparison between commission and subscription pricing shouldn't be treated as a universal price card. Contract terms, included features, payment handling, marketing services, guest ownership, and cancellation rules can change the effective cost. The correct comparison uses the restaurant's own covered revenue and direct-booking mix.
A 2% to 4% commission on covered revenue can matter when fixed costs are already heavy, especially alongside labor. A reported benchmark puts median labor cost at 34.2% of sales for profitable full-service operators, compared with 42.9% for operators reporting a loss.FirstHR That is an 8.7-percentage-point difference, so a recurring commission shouldn't be assessed in isolation from the labor ratio.
The right model depends on the operation:
- A new restaurant seeking reach: An aggregator may justify its variable cost if it brings incremental guests.
- An established local venue: A subscription model often makes more sense when regulars already book directly.
- A high-volume dining room: The operator should calculate the annual commission against the fixed fee and the value of direct guest relationships.
- A multi-location group: Predictability and shared reporting can outweigh the acquisition value of a commission marketplace.
The commercial test: Ask whether the platform creates an incremental cover or merely charges for a cover the restaurant would have captured anyway.
The buyer should request a full annual scenario using actual covers, booking sources, cancellation behavior, and contract terms. Headline monthly pricing is incomplete. The relevant number is the total cost per incremental cover, after staff time and implementation work.
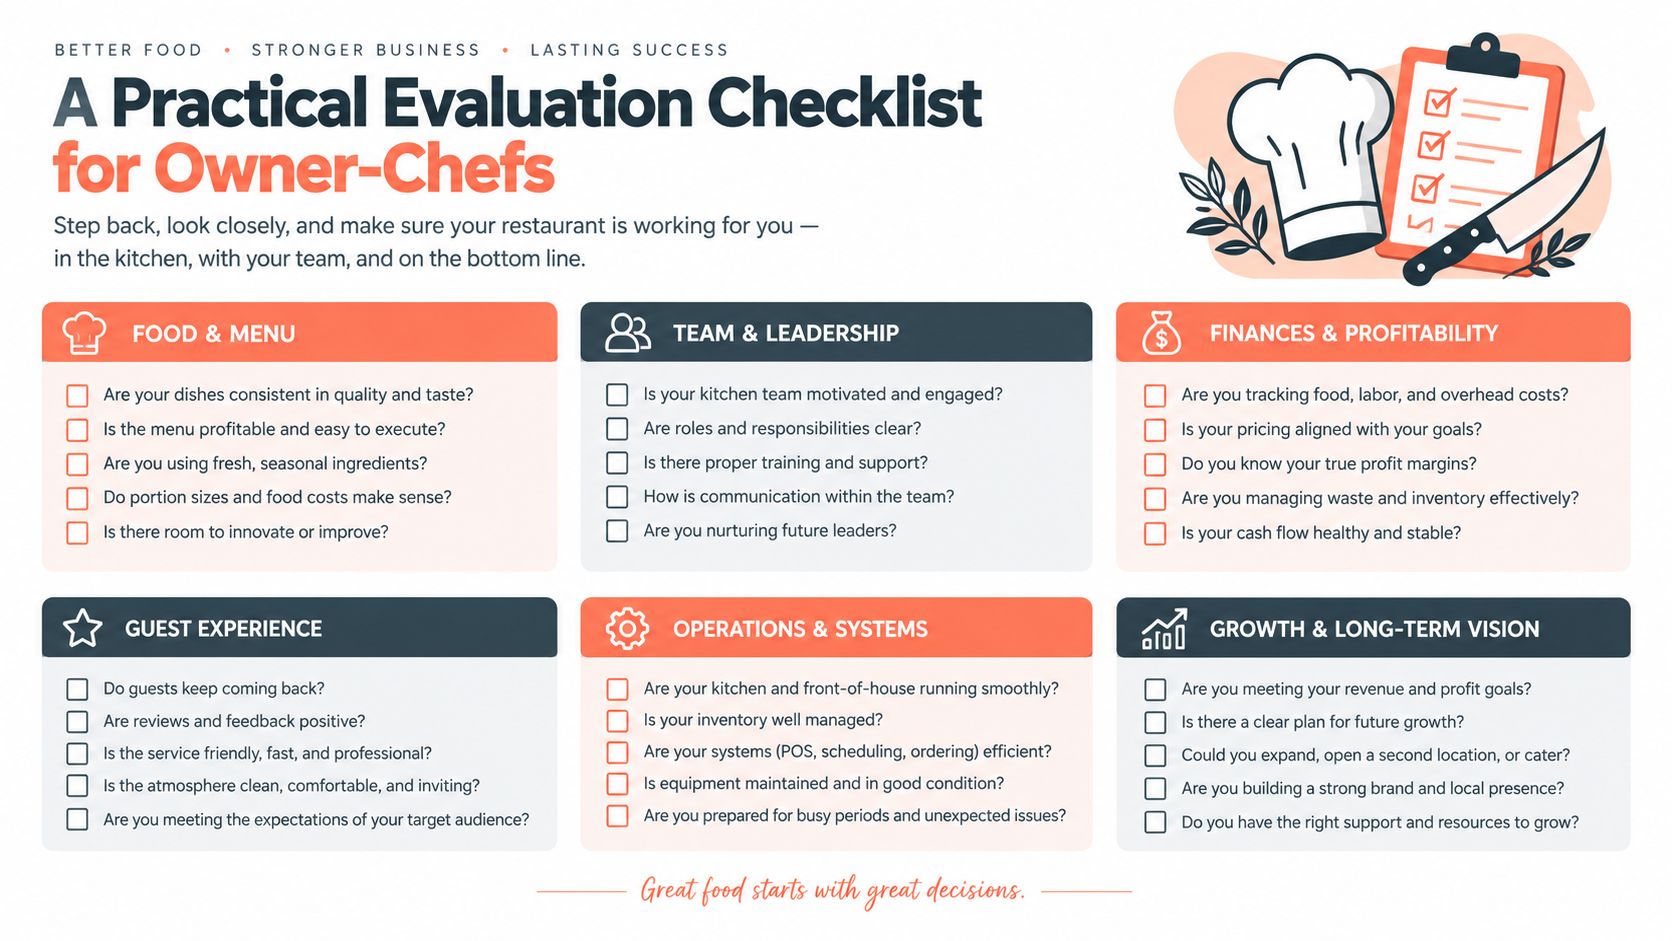
A Practical Evaluation Checklist for Owner-Chefs
A short vendor trial can reveal more than a long presentation if the restaurant measures the right things. The owner-chef or GM should begin with a baseline from normal service, then compare the same dayparts, staffing pattern, and floor-plan constraints after implementation.
Start with capacity, not bookings
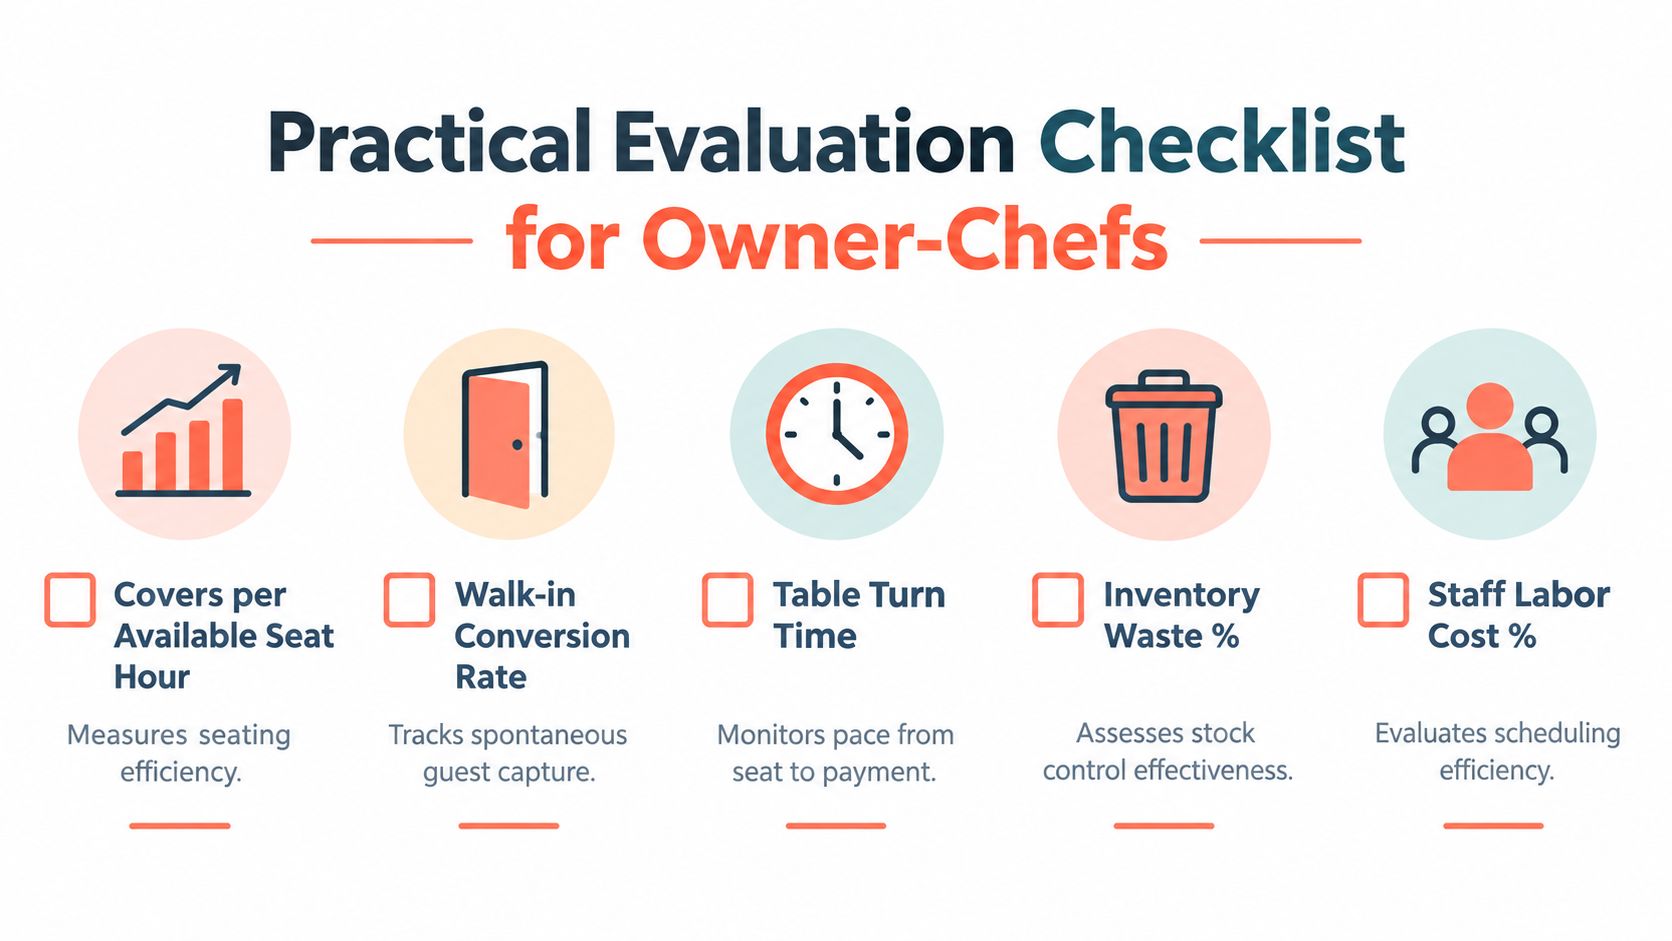
Gross bookings are a weak success measure. A restaurant can increase bookings while making the dining room slower, overloading the kitchen, or creating more host work. The first metric should be covers per available seat hour, followed by the service measures that explain it.
- Seat utilization: Check whether the system fills suitable tables without consuming configurations needed later.
- Walk-in conversion: Record how many spontaneous guests are seated rather than turned away or left waiting.
- Table turn time: Measure the interval from seating to payment and table release, not just the reservation duration.
- No-show-adjusted revenue: Remove bookings that never become covers so the report reflects real service.
- Incremental covers: Count covers gained without adding tables, expanding hours, or adding staff.
The peer-reviewed simulation study on restaurant table assignment found that policy choice alone produced approximately a 10% to 15% difference in customer waiting times between the most and least efficient approaches across 1,000 simulation runs per scenario.Peer-reviewed table assignment study The practical implication is straightforward. A table-management system should recompute feasible combinations as reservations, walk-ins, cancellations, and dining-duration estimates change.
Test the system under pressure
A proper trial shouldn't use only a quiet lunch. The team should load realistic party sizes, overlapping arrivals, late guests, table holds, cancellations, and a walk-in queue. The host should run it while the manager watches whether the screen supports quick decisions or creates another administrative task.
Ask the vendor to demonstrate:
- A constrained floor plan: What happens when the most suitable table is occupied?
- A late arrival: Can the host adjust timing without losing the original booking?
- A large party: Does the system preserve future capacity rather than use every available seat?
- A sudden cancellation: Can the waitlist or direct availability update immediately?
- A post-service review: Can the manager connect covers, table times, labor, and revenue?
A vendor that reports capacity improvement without explaining the baseline, demand pattern, staffing, and service constraints hasn't proved much. The trial should produce a simple before-and-after record. If the software claims more covers, the manager should verify whether labor minutes per cover, kitchen delays, guest waits, and table release time moved in the right direction.
Implementation Roadmap and Belgian GKS Compliance
Implementation should protect service first. A rushed launch creates bad data, staff resistance, and a false conclusion that the software doesn't work.
Establish the operating baseline
Before configuration, the manager should record the current floor plan, table combinations, booking sources, party-size pattern, arrival behavior, table release process, and core KPIs. The baseline doesn't need to be elaborate. It needs to be consistent enough to compare a normal service with the first weeks after launch.
The rollout should follow a controlled sequence:
- Configure: Build the floor plan, zones, table combinations, pacing rules, booking policies, and user permissions.
- Train: Teach hosts and managers the decisions they must make during service, not every available feature.
- Soft launch: Run the system on a limited service or selected daypart while preserving a clear fallback process.
- Review: Compare covers, wait times, table release, cancellations, walk-ins, and labor deployment against the baseline.
- Expand: Add locations, channels, or advanced workflows only after the core seating process works reliably.
A 60-day rollout is more defensible than a single launch night. The first period should focus on accurate floor data and staff habits. The next should test pacing, walk-ins, and reporting. Management should avoid changing several operational variables at once, because that makes the software's contribution impossible to isolate.
Keep reservation software separate from fiscal software
Belgian operators have a compliance checkpoint that can't be left to a reservation vendor. A Geregistreerd Kassasysteem, or GKS, is required when annual turnover from on-premises restaurant and catering services exceeds €25,000, excluding VAT and drinks, according to the Flemish government guidance on the registered cash register. The requirement triggers VAT receipt obligations that ordinary till software can't satisfy on its own.
Reservation and table management should therefore remain clearly separated from the certified fiscal functions of the GKS. The reservation platform can manage demand, seating, table status, guest notes, and availability. The compliant point-of-sale and GKS must handle the fiscal receipt workflow. Managers should confirm the integration path, data ownership, and receipt responsibilities before switching anything on.
Belgian operators should also review VAT on food and restaurant services with their accountant or fiscal adviser. Software can move information between systems, but it doesn't remove the operator's compliance responsibility.
Implementation rule: Never let a convenient reservation workflow blur which system is responsible for the legally required receipt.
Measuring Whether the Software Actually Paid for Itself
The profitability test begins after launch, not at the demo. Compare the new workflow with the baseline using covers, available seats, table release time, walk-in conversion, labor minutes per cover, and no-show-adjusted revenue. Gross booking volume alone can hide a poor result.
Cancellation timing deserves special attention. A 2026 dataset covering 3,768,761 reservations at 2,417 restaurants recorded an average no-show rate of 2.33%. Of 566,049 cancellations, 56% occurred within 24 hours of the booking or after the reservation had started, according to Resos' restaurant no-show analysis. Same-day cancellations leave little time to refill a table, so the manager should track live availability, waitlist recovery, and rapid reassignment separately from ordinary cancellations.
Labor provides the financial connection. If the restaurant adds covers without adding staff, the result may improve contribution margin. If the host spends more time fixing software errors or the kitchen absorbs poorly paced arrivals, the apparent capacity gain may not be profitable. The restaurant profit margin calculator can help the operator translate service changes into a clearer margin review.
For a low-risk test, independent operators can trial 10seat with no credit card, five-minute setup, and a free “On the House” plan up to 50 covers. The trial should still be judged against the restaurant's own baseline. Software has paid for itself only when the dining room, team, and financial results all show the improvement.
10seat provides commission-free reservation management for independent restaurants in the Benelux, including real-time availability, smart table allocation, automated confirmations, waitlists, and walk-in handling. Visit 10Seat to test the workflow against the restaurant's own floor plan and measure whether it improves capacity without adding tables or manual work.